Hey Penny Stock Players, DO NOT invest in a single marijuana stock before reading this post!
Weed was initially legalized in the United States by Colorado on November 7, 2012. The moment marijuana was legalized, there were tons of penny stock companies who jumped on the opportunity to promote their stock and claimed to be entering into the marijuana industry.
Many of these companies though were found out to be frauds and have since been penalized by the government and the SEC either through fines or suspensions. But each year, about this time, there’s a new influx of traders trading the marijuana industry, which you will be able to see by the following charts.
Well, my friend, the time is upon us once again as we’ve seen IJJP and THCZ ride this marijuana puppy up to tremendous gains. IJJP ran from .0006 to .006 in a matter of months. THCZ ran from doubles (around .007s) to up to .268 for a gain of 37 times your money in two months.
Now, obviously, you wouldn’t reasonably ride it all the way up. The smart thing to do would be to buy at support and sell at resistance with stop losses in place that also move up as the price moves up. OR, sell a percentage of your shares and ride freebies to a ridiculous gain.
Even by sticking to your system that you’ve developed over time, you could have traded either IJJP or THCZ for multiple support buys and resistance sells.
Now, let’s look at a few charts. Since we started off talking about IJJP and THCZ, we will look at them first.
Here is IJJP’s chart:
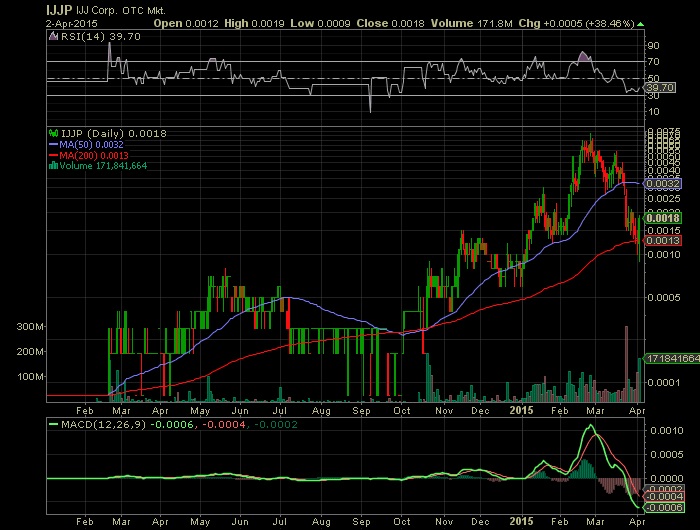
IJJP had a small run in March through June of 2014. But the true run didn’t start until November of 2015. Coincidently, the run came after the 50 day moving average dipped below the 200 day moving average and then crossed back up to form a golden cross. But the golden cross means nothing without volume, which, at the time, IJJP had plenty of. Look at that volume coinciding with the golden cross in late October of 2014. That’s a long term buy signal if I’ve ever seen one!
Next, we look at THCZ:

The yellow circle indicates the golden cross and the blue box shows how the volume increased a week or so before the cross occurred. Of course the volume wasn’t out of this world, but it was more than quadruple what had been pouring into the stock.
I did not put other indicators on either chart but you can clearly see there are multiple dips that you could have bought on the way up, if all of your trading rules are met during the dip. However, one indicator, the RSI has dipped almost to 50 before it popped back up for the next leg. Also, check the press releases and news because they often also tell a story.
Now let’s look at the FITX chart:

FITX, as noted by the yellow circles, had two golden crosses; one around April of 2012 and the other around January of 2014. The first golden crossed proved to be profitable despite basically no volume. However, look at how much further the second gold cross ran with WAY much more volume. FITX ran from doubles to 12 cents! I’m sure you can calculate the percentage gain there. And that was in a matter of two months.
The next two charts, MJNA and ERBB look almost identical. Here are their charts:
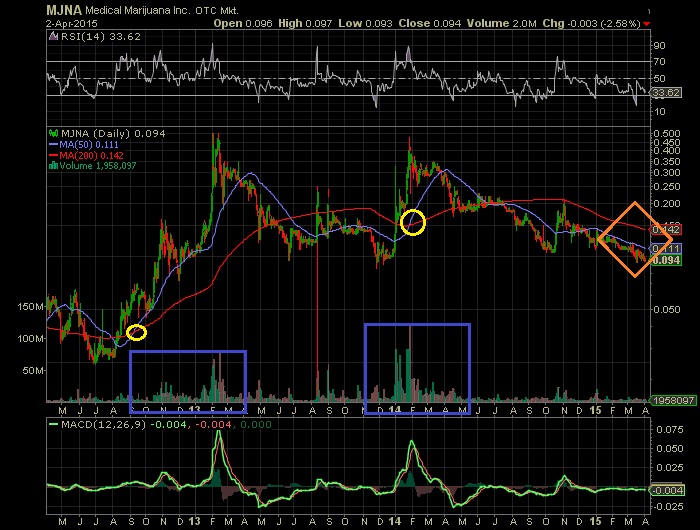
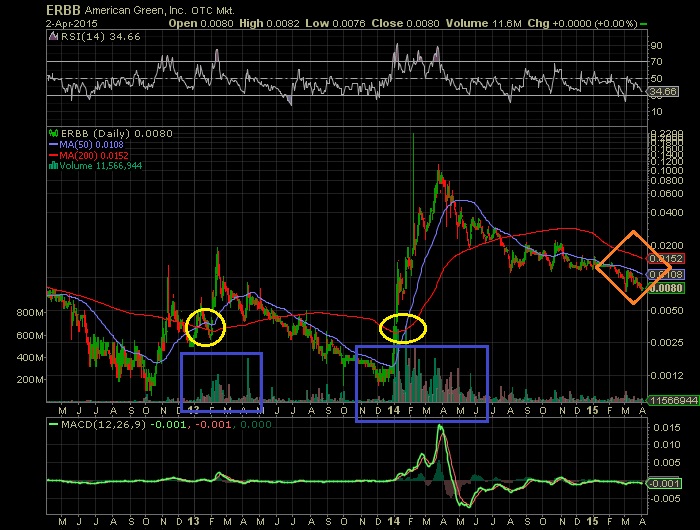
Okay, so they are not exactly identical, but you can see the pattern. The top chart is MJNA and the bottom chart is ERBB. As you can see, they both had two golden cross with the second one, on both charts, showing more volume. However, MJNA’s first run was massive because it had another influx of high volume before the steam ran out of the run.
The orange diamond on both charts indicates another potential golden cross opportunity. But look at the volume on both charts. It is practically non-existent. You would be wise to wait for confirmation of the golden cross AND for volume before predicting a move north. But keep an eye on them for the interest in marijuana stocks is picking up again.
Finally, we will look at two more charts: ILIV and VMGI. Here is the chat for ILIV:

ILIV has been beat to death. Man, what a dump fest. However, notice how recently the volume has picked up as noted by the blue box. Obviously, check with the CEO and the TA for true share structures and make sure they aren’t planning a reverse split. Also look through the PRs and the News to see if anything positive is in the works. But for a pure trade perspective, if all your rules check out, ILIV might provide a nice bottom feeder bounce soon. Again, I have not done any research on this stock except for looking at the chart. So do your own full due diligence before entering any trade.
And finally, here is the VMGI chart:

Man, this stock used to move on air. The two golden cross proved successful with little to no volume. In fact, the second golden cross came AFTER a substantial move north, also on almost no volume. You ask yourself, why does this stock now require so many more shares traded to move? Because the share has been diluted and as it gets watered down, the price decreases and more shares must be traded to weed out the 1 tick flippers.
Time will tell where this is headed. But if history repeats, VMGI will have a huge run coming.
There you have it. A look at the marijuana industry. Who will provide the next big run? ILIV? ERBB? VMGI? MJNA? Another weed stock? Only time will tell. So keep an eye on the stocks in the sector and follow your rules as you catch the next ride north!
If you liked this blog or have any suggestions, please comment below. And don’t forget to read our other posts and follow us as there are many more posts to come.
